InAI AdvancesbyWei-Meng LeeGeospatial Data Analysis using DuckDBSimplifying Spatial Data Analysis with DuckDB’s Spatial ExtensionsJan 12Jan 12
InAI AdvancesbyWei-Meng LeePerforming Analytical Queries with LLMsA Practical Approach to Using LLMs for Data Exploration and AnalysisJan 10Jan 10
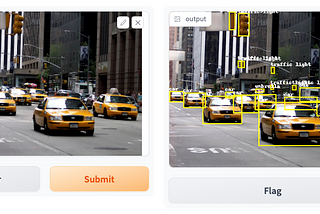
InLevel Up CodingbyWei-Meng LeeSharing your Machine Learning or Deep Learning Projects with Users with GradioCreate a user-friendly web-based UI to let users interact with your trained modelsMay 16, 20231May 16, 20231
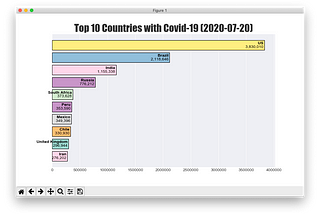
InLevel Up CodingbyWei-Meng LeePerforming Data Visualization using the Covid-19 DatasetIn my previous article “Performing Data Analytics on the Covid-19 Dataset using Python, NumPy and Pandas”, I walked you through the steps…Jun 2, 2020Jun 2, 2020
InTDS ArchivebyWei-Meng LeeCreating a Racing Bar Chart using the Covid-19 Datasethttps://youtu.be/5UKdoEoFaKAJul 27, 20201Jul 27, 20201
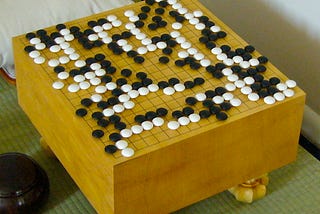
InTDS ArchivebyWei-Meng LeeDeveloping the Go Game (围棋) using matplotlib and NumPy — Part 1Drawing the Go Board using matplotlibNov 29, 2021Nov 29, 2021
InTDS ArchivebyWei-Meng LeeDeveloping the Go Game (围棋) using matplotlib and NumPy — Part 2Implementing the rules of GoDec 14, 20211Dec 14, 20211
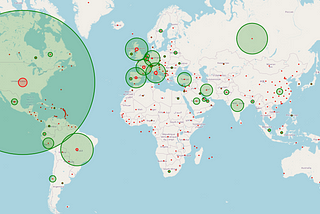
InTDS ArchivebyWei-Meng LeeVisualization in Python —Visualizing Geospatial DataLearn how to use folium to easily display maps and markersDec 30, 2021Dec 30, 2021
InTDS ArchivebyWei-Meng LeeVisualization in Python: Finding Routes between PointsLearn how to geocode your locations and calculate the shortest route between points based on distance, travel mode and timeJan 3, 20222Jan 3, 20222
InLevel Up CodingbyWei-Meng LeeVisualization in Python — Creating Dynamic Time Series using matplotlibLearn how to create a dynamic time series using matplotlibJan 3, 2022Jan 3, 2022
InLevel Up CodingbyWei-Meng LeeVisualization in Python — Creating Word CloudUsing word clouds to visualize text contentJan 5, 2022Jan 5, 2022
InLevel Up CodingbyWei-Meng LeePlotting Choropleth Maps in PythonLearn how to use Plotly to plot choropleth mapsFeb 11, 20221Feb 11, 20221
InLevel Up CodingbyWei-Meng LeeCreating Dynamic Auto-Updated Time Series using GrafanaLearn how to fetch data from a REST API backend using the SimpleJson Data SourceMar 17, 2022Mar 17, 2022
InLevel Up CodingbyWei-Meng LeeDisplaying Real-Time Sensor Data in Grafana using MQTTLearn how to build the MQTT data source and use it inMar 19, 20221Mar 19, 20221
InTDS ArchivebyWei-Meng LeePlotting Time Series BoxplotsLearn how to plot time series boxplots using matplotlib and SeabornMar 25, 20222Mar 25, 20222
InLevel Up CodingbyWei-Meng LeeCreating Candlestick Plots for StocksLearn how to use matplotlib, Plotly, Cufflinks, and bqplot to create candlestick plotsMar 28, 2022Mar 28, 2022
InTDS ArchivebyWei-Meng LeeVisualizing Polars DataFrames using Plotly ExpressLearn how to plot your Polars DataFramesJul 19, 2022Jul 19, 2022
InTDS ArchivebyWei-Meng LeeImage Data Augmentation for Deep LearningUnderstand what is image data augmentation and how to use it using Keras for your deep learning projectsOct 26, 2022Oct 26, 2022
InTDS ArchivebyWei-Meng LeeCreating Time Series Plots in GrafanaLearn how to plot dynamic time series plots using Python and GrafanaFeb 9, 2023Feb 9, 2023
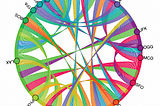
InTDS ArchivebyWei-Meng LeePlotting Chord Diagrams in PythonHow to use Holoviews to plot chord diagrams to show relationships between various data attributesFeb 15, 20232Feb 15, 20232