InTDS ArchivebyWei-Meng LeeJoining Pandas DataFramesLearn how to merge Pandas Dataframes easilyAug 27, 20212Aug 27, 20212
InTDS ArchivebyWei-Meng LeePlotting Venn Diagrams in PythonLearn how to use venn diagrams to show the relationships between two or more sets of dataFeb 24, 20232Feb 24, 20232
InTDS ArchivebyWei-Meng LeeWorking with Hugging Face DatasetsLearn how to access the datasets on Hugging Face Hub and how you can load them remotely using DuckDB and the Datasets libraryJun 29, 2023Jun 29, 2023
InTDS ArchivebyWei-Meng LeeManipulating Values in Polars DataFramesLearn how to use the various methods in Polars to manipulate your dataframesJul 20, 20221Jul 20, 20221
InTDS ArchivebyWei-Meng LeeData Cleansing in PolarsLearn how to perform data cleansing in your Polars DataFramesAug 8, 20222Aug 8, 20222
InLevel Up CodingbyWei-Meng LeePerforming Data Analytics on the Covid-19 Dataset using Python, NumPy and PandasIn this article, I will make use of the Novel Corona Virus 2019 Dataset located at…Jun 2, 20201Jun 2, 20201
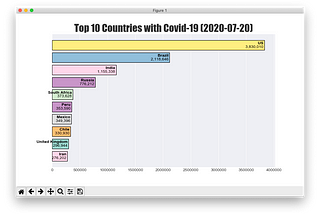
InLevel Up CodingbyWei-Meng LeePerforming Data Visualization using the Covid-19 DatasetIn my previous article “Performing Data Analytics on the Covid-19 Dataset using Python, NumPy and Pandas”, I walked you through the steps…Jun 2, 2020Jun 2, 2020
InTDS ArchivebyWei-Meng LeeCreating a Racing Bar Chart using the Covid-19 Datasethttps://youtu.be/5UKdoEoFaKAJul 27, 20201Jul 27, 20201
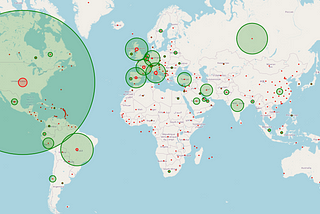
InTDS ArchivebyWei-Meng LeeVisualization in Python —Visualizing Geospatial DataLearn how to use folium to easily display maps and markersDec 30, 2021Dec 30, 2021
InTDS ArchivebyWei-Meng LeeVisualization in Python: Finding Routes between PointsLearn how to geocode your locations and calculate the shortest route between points based on distance, travel mode and timeJan 3, 20222Jan 3, 20222
InLevel Up CodingbyWei-Meng LeeVisualization in Python — Creating Dynamic Time Series using matplotlibLearn how to create a dynamic time series using matplotlibJan 3, 2022Jan 3, 2022
InLevel Up CodingbyWei-Meng LeeVisualization in Python — Creating Word CloudUsing word clouds to visualize text contentJan 5, 2022Jan 5, 2022
InLevel Up CodingbyWei-Meng LeePlotting Choropleth Maps in PythonLearn how to use Plotly to plot choropleth mapsFeb 11, 20221Feb 11, 20221
InLevel Up CodingbyWei-Meng LeeCreating Dynamic Auto-Updated Time Series using GrafanaLearn how to fetch data from a REST API backend using the SimpleJson Data SourceMar 17, 2022Mar 17, 2022
InLevel Up CodingbyWei-Meng LeeUsing MQTT to Push Messages Across DevicesLearn how to use MQTT in your Python applicationsMar 19, 2022Mar 19, 2022
InLevel Up CodingbyWei-Meng LeeDisplaying Real-Time Sensor Data in Grafana using MQTTLearn how to build the MQTT data source and use it inMar 19, 20221Mar 19, 20221
InTDS ArchivebyWei-Meng LeePlotting Time Series BoxplotsLearn how to plot time series boxplots using matplotlib and SeabornMar 25, 20222Mar 25, 20222
InLevel Up CodingbyWei-Meng LeeCreating Candlestick Plots for StocksLearn how to use matplotlib, Plotly, Cufflinks, and bqplot to create candlestick plotsMar 28, 2022Mar 28, 2022
InTDS ArchivebyWei-Meng LeeGetting Started with the Polars DataFrame LibraryLearn how to manipulate tabular data using the Polars dataframe library (and replace Pandas)Jul 13, 20222Jul 13, 20222
InTDS ArchivebyWei-Meng LeeUnderstanding Lazy Evaluation in PolarsUnderstand what is eager and lazy execution and how you can use lazy execution to optimize your queriesJul 15, 20222Jul 15, 20222